Data Report Visualation
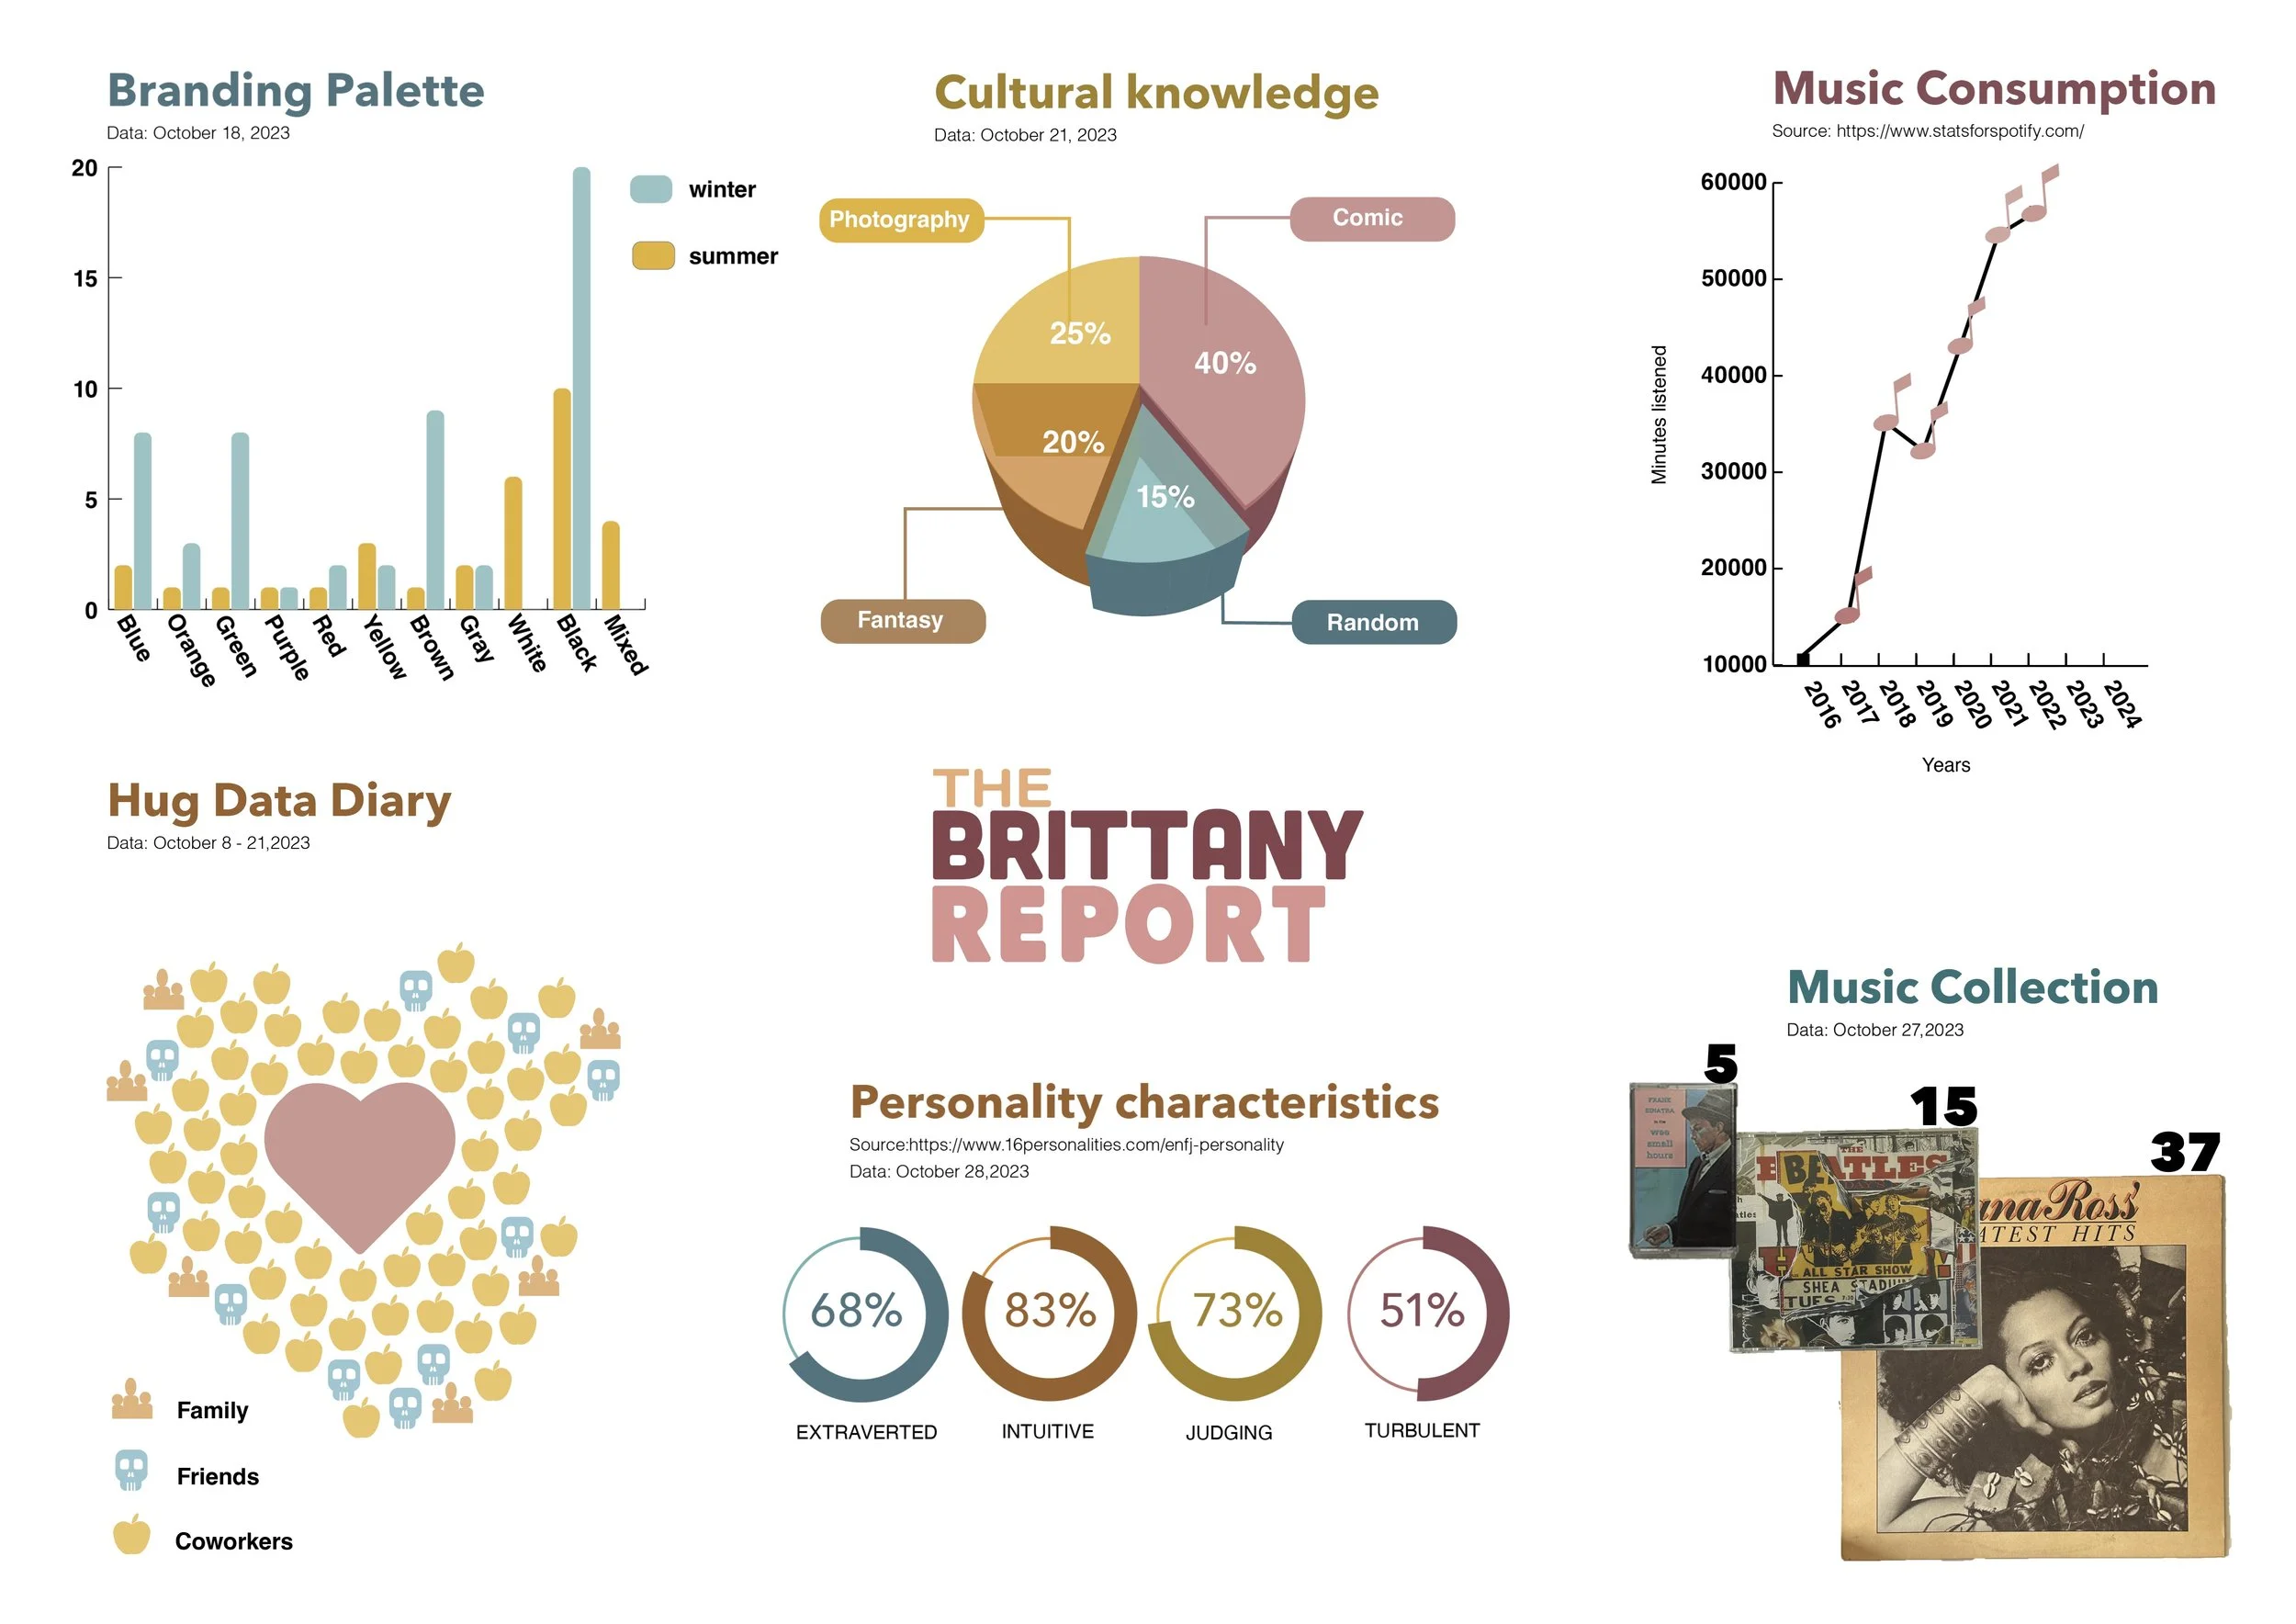
The Brittany Report consists of a variation of data collected and formatted in digestible visual illustration. Using Adobe Illustrator to convey the message effectively, create bar, pie, and line graphs. These graphs as well as imagery and drawings are used for size and quantity references. Data is all around us and using graphic design helps us better understand and process information.
Year
Fall 2023
